NDIS Quarterly Report – 2020-21 Q1

The NDIA has released the latest Quarterly Report. The report is a summary of the performance and operations of the NDIA. It covers the three months from 1 July to 30 September 2020.
To save you reading through the whole report, we have pulled out some important insights.
Participants and their plans
Number of participants in the scheme
412,543 participants are receiving supports from the NDIS. This represents a 6% increase from the last quarter. You can see the consistent increase of active participants with approved plans since the start of the scheme in the table below.

Children in the NDIS (aged 0 to 6 years)
There is still a high proportion of children entering the scheme. Of the participants with approved plans, 16% were children. Of the new participants, 37% were children.
A higher proportion of participants with Developmental Delay entered the Scheme again this quarter. This is consistent with the number of children entering the scheme. 22.8% entered the scheme this quarter and 17.7% in the June quarter. There was only 6.3% in previous quarters through to 31 March 2020 combined.

Participant characteristics
Participant diversity continues with higher proportions of Aboriginal and Torres Strait Island and Culturally and Linguistically Diverse (CALD) Scheme entrants this quarter.
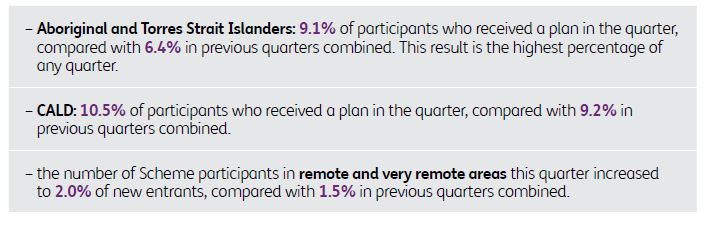
In addition, 12.8% of participants who received a plan in the quarter had psychosocial disability compared to 9.6% in the previous quarters combined.
Participant Service Guarantee and Participant Service Improvement Plan
Key trends in complaints
The number of completed complaints has been consistent over recent quarters, despite increases in participant numbers. 95% of complaints in the quarter were closed within 21 days. This is a significant improvement when compared to rates earlier in the Scheme.

Providers and the growing market
Growth in the NDIS market
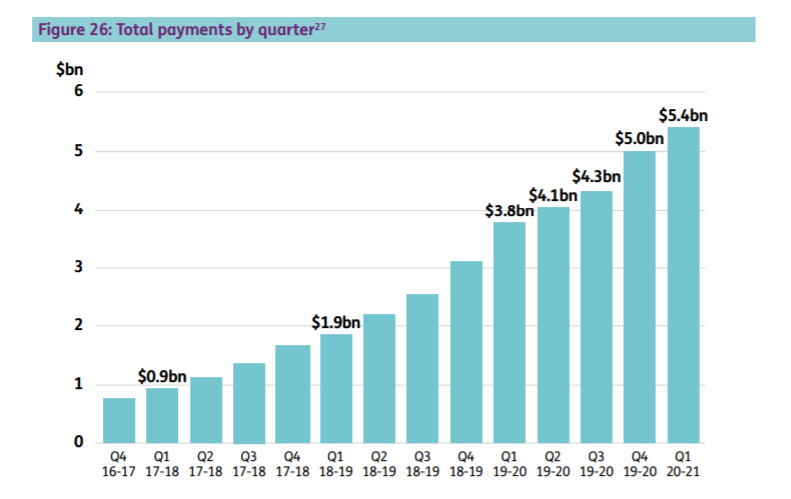
Payments for NDIS supports have grown 8% in the last quarter. The amount paid each quarter for NDIS supports continues to increase, as shown in the graph below.
Active providers
Since the start of the Scheme, 15,319 providers have supported participants. Of these:
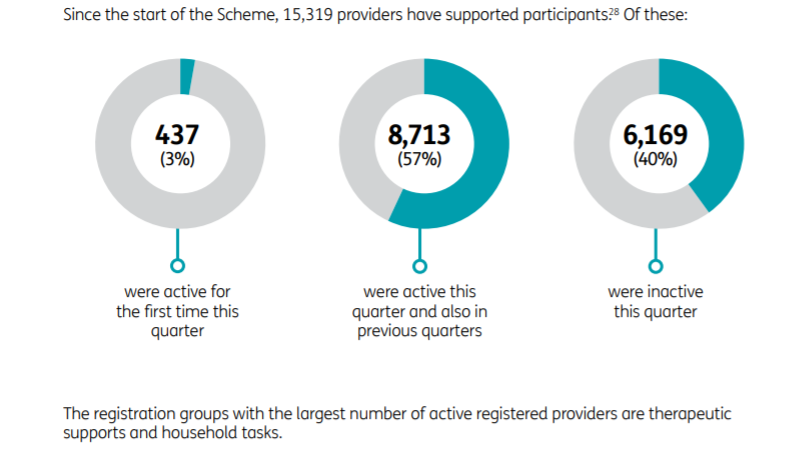
The registration groups with the largest number of active registered providers are therapeutic supports and household tasks. These groups are consistently one of the largest registration groups.

Financial sustainability
High levels of inflation in the Scheme have persisted over time. This is despite the Scheme's increasing maturity. It is something the NDIA needs to address if the Scheme is to be financially sustainable into the future. This is particularly evident for participants in SIL.

The growth in average annualised payments for non-SIL participants has also been high.

View the full Quarterly Report on the NDIS website.

|
Looking to start or expand your NDIS business? Choosing where to start or expand your NDIS business can be difficult without the right data. Our eBook can help you evaluate locations that may be ideal to deliver services to, with data across every state. |
More industry news


